Who?
Founders of the project Bianca Kramer and Jeroen Bosman from Utrecht University Library, Utrecht, Netherlands came up with an idea to tackle the questions such as: how the innovative tools impact research workflows and how they support a Good, Efficient and Open Science (G-E-O model). These questions they addressed to researchers and people supporting research in different disciplines and different career stages.
What & How?
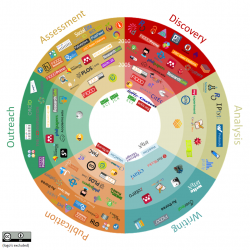
Dissemination activities range from the distribution of the tools database in Google Spreadsheets , the global survey (i.e., was open from May 10, 2015, until February 10, 2016), interactive visualizations of survey results , collaboration with 108 partners (using their communication channels and mailing lists) to public blogs, social media, talks, webcasts and podcasts. One of the most interesting outputs is a snapshot of 101 tools visualized in a circle aligned to six research hlifecycle phases. To the dissemination outputs count also datasets and scripts, as well as open peer reviewed scientific article and poster.
When?
In late 2013 founders of the project came up with an idea to gather tools that researchers use in their research workflow. Dissemination started in 2014 when they went public with the google spreadsheet and invited researchers to add their tools. Around 200 tools were gathered very quickly; in January 2015 they published “the circle” with 101 most important innovative tools for scholarly communication.
The goal of the project was to use crowdsourcing for the database of innovative tools, so the dissemination was started in the very early stages of the project, after the first research lifecycle phase - Design. From the first dissemination activities, new opportunities and activities were created. In general, dissemination is noticeable after each research lifecycle phase.
Relation to Open Science
All dissemination outputs of the project are publicly available and licensed under a Creative Commons Attribution (CC-BY) or Attribution-ShareAlike (CC BY-SA) license, and thus compatible with the Open Definition. Furthermore, published journal articles are open access.
The outcomes of the project can be used by libraries, research support, funders, but also by researchers themselves. Participants of the survey got immediate preliminary feedback from the survey. They could compare their usage of the tools with the average of their peers (i.e., for the six phases of the research cycle, a radar chart shows whether someone’s tool usage is more traditional or more innovative than the average of their peer group).
Effort
The project is characterized with high-quality reports, images, videos and blogs. The dissemination costs can be estimated as medium (< EUR 50,000). Worth mentioning is that part of the dissemination is conducted by 108 partners (mostly universities and publishers) and survey participants were not paid.
Impact
The global survey was designed to have a broader coverage including all countries, 7 different disciplines (derived from Scopus categorization) and researchers in different career stages. It was open for anyone to take, with no systematic control on who took it. The survey was available in 7 languages (English, Spanish, French, Chinese, Russian, Japanese and Arabic) and it was taken by 20,663 researchers, librarians, editors, publishers and other groups involved in research.
Impact: more than 600 tools are identified and gathered in a database which is publicly available. 101 tools with the most impact are visualized in an image (“the circle”), categorized based on six research lifecycle phases.
Gender
One of the co-founders of the project is a woman - Bianca Kramer from Utrecht University Library, Netherlands, who also plays an important role in the dissemination.
The global survey constructed within the project was intended to be as general as possible, without particular gender targeting. Participants of the global survey were not asked about their gender. No facts are found about the gender of the volunteers that contributed in the google spreadsheet. No explicit ambition is noticed regarding gender sensitive text and communication within the dissemination materials.
Highlight
|
||
|---|---|---|
|
By applying crowdsourcing it was possible to identify and gather more than 600 tools in a database, which is publicly available. 101 tools with the most impact are visualized in a diagram (“the circle”), categorized based on six research lifecycle phases. The image became very popular on social media; as a result, it is widely known and as such has become the face of the project. |
||
Link
For a more extensive analysis of the 101 Innovations in Scholarly Communications case study, please follow the link: OpenUP D4.1 Practices evaluation and mapping Methods tools and user needs


